
.png) Example 1: Brood
Onset in Spring
Example 1: Brood
Onset in Spring
.png) Example 2: Queen
Problems / Queenlessness
Example 2: Queen
Problems / Queenlessness
.png) Example 3:
Swarming Behavior
Example 3:
Swarming Behavior
.png) Example 4: Winter
Weakening
Example 4: Winter
Weakening

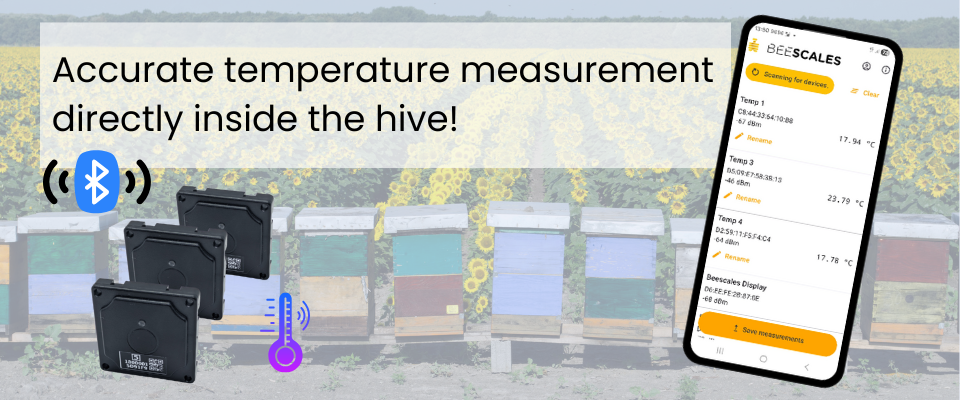
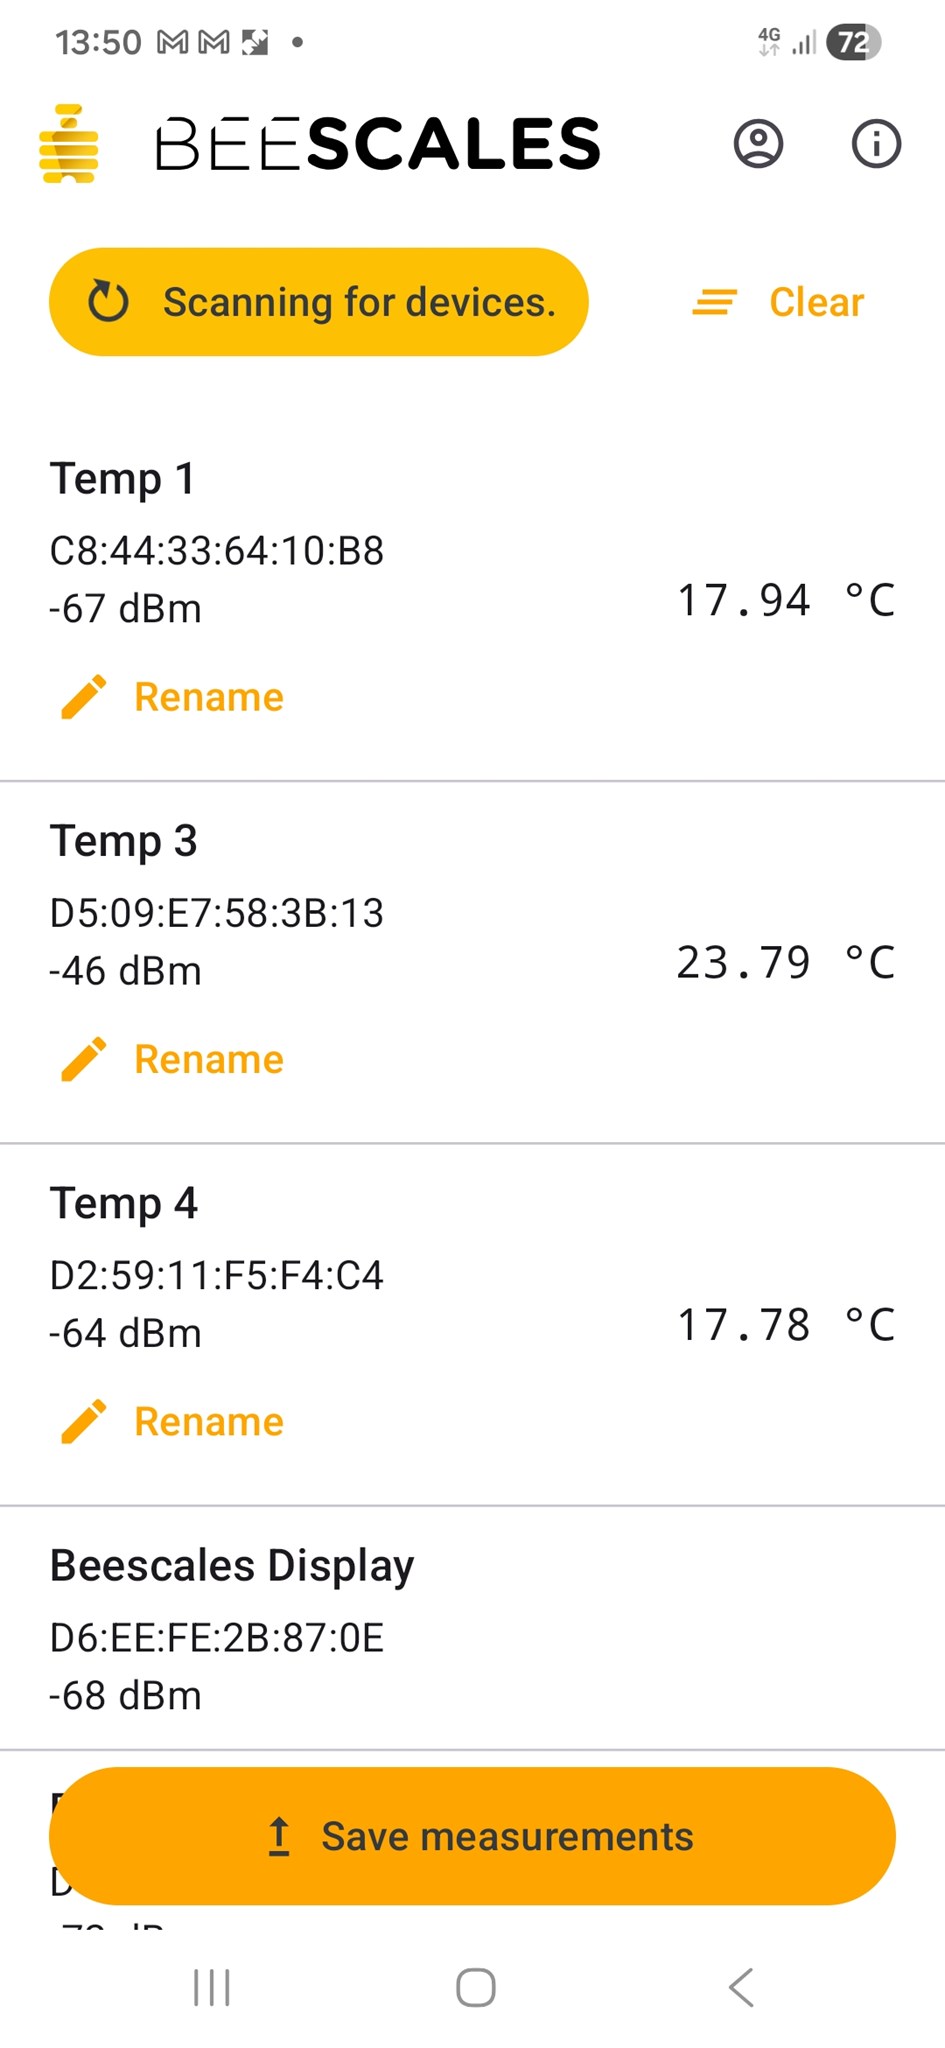
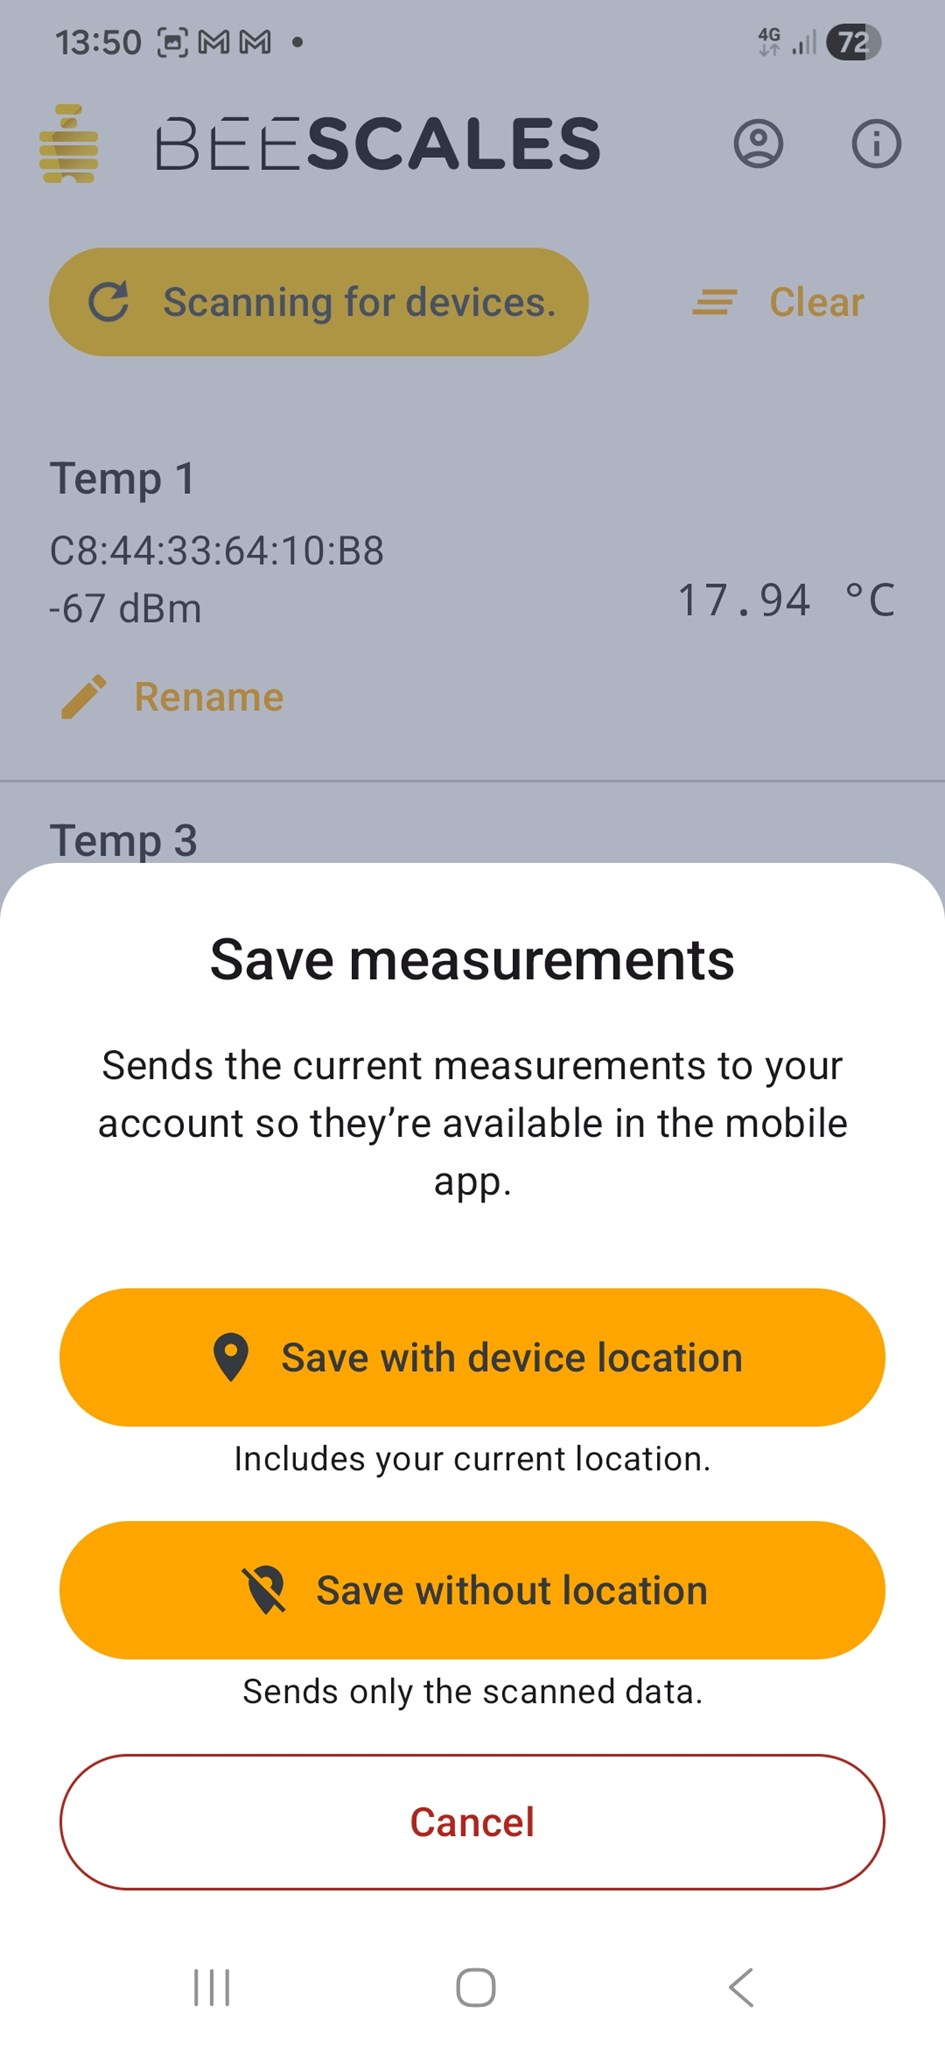
Bluetooth temperature sensors
29,90 €


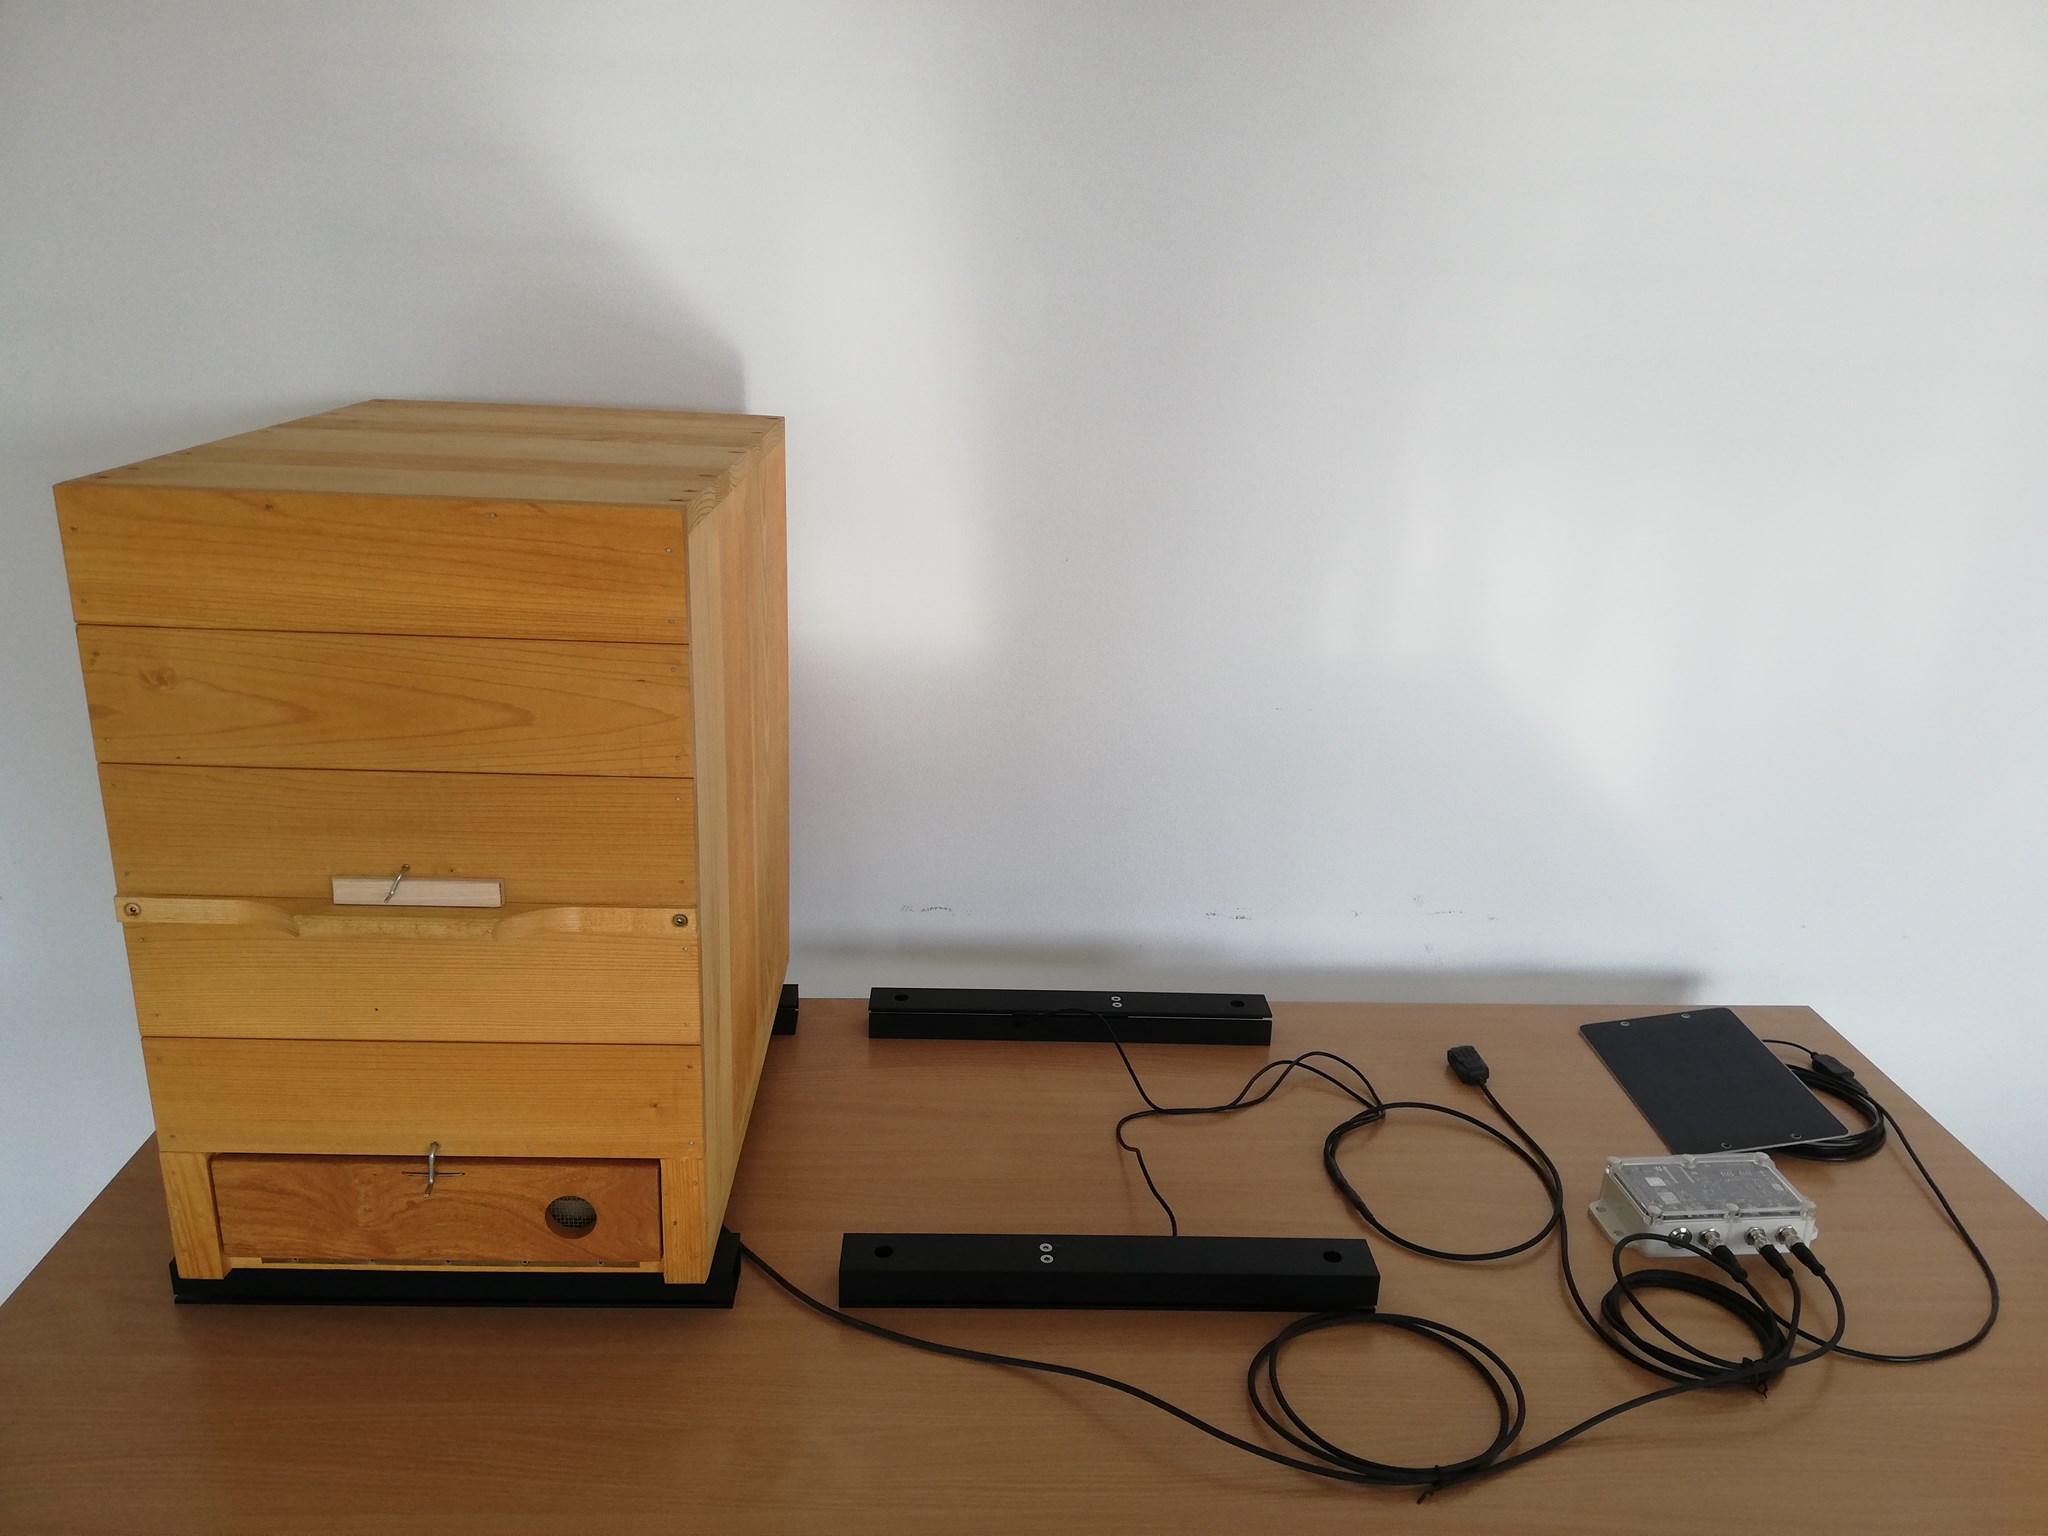
Bee Scale BeeScales.io for 2 Bee Hives
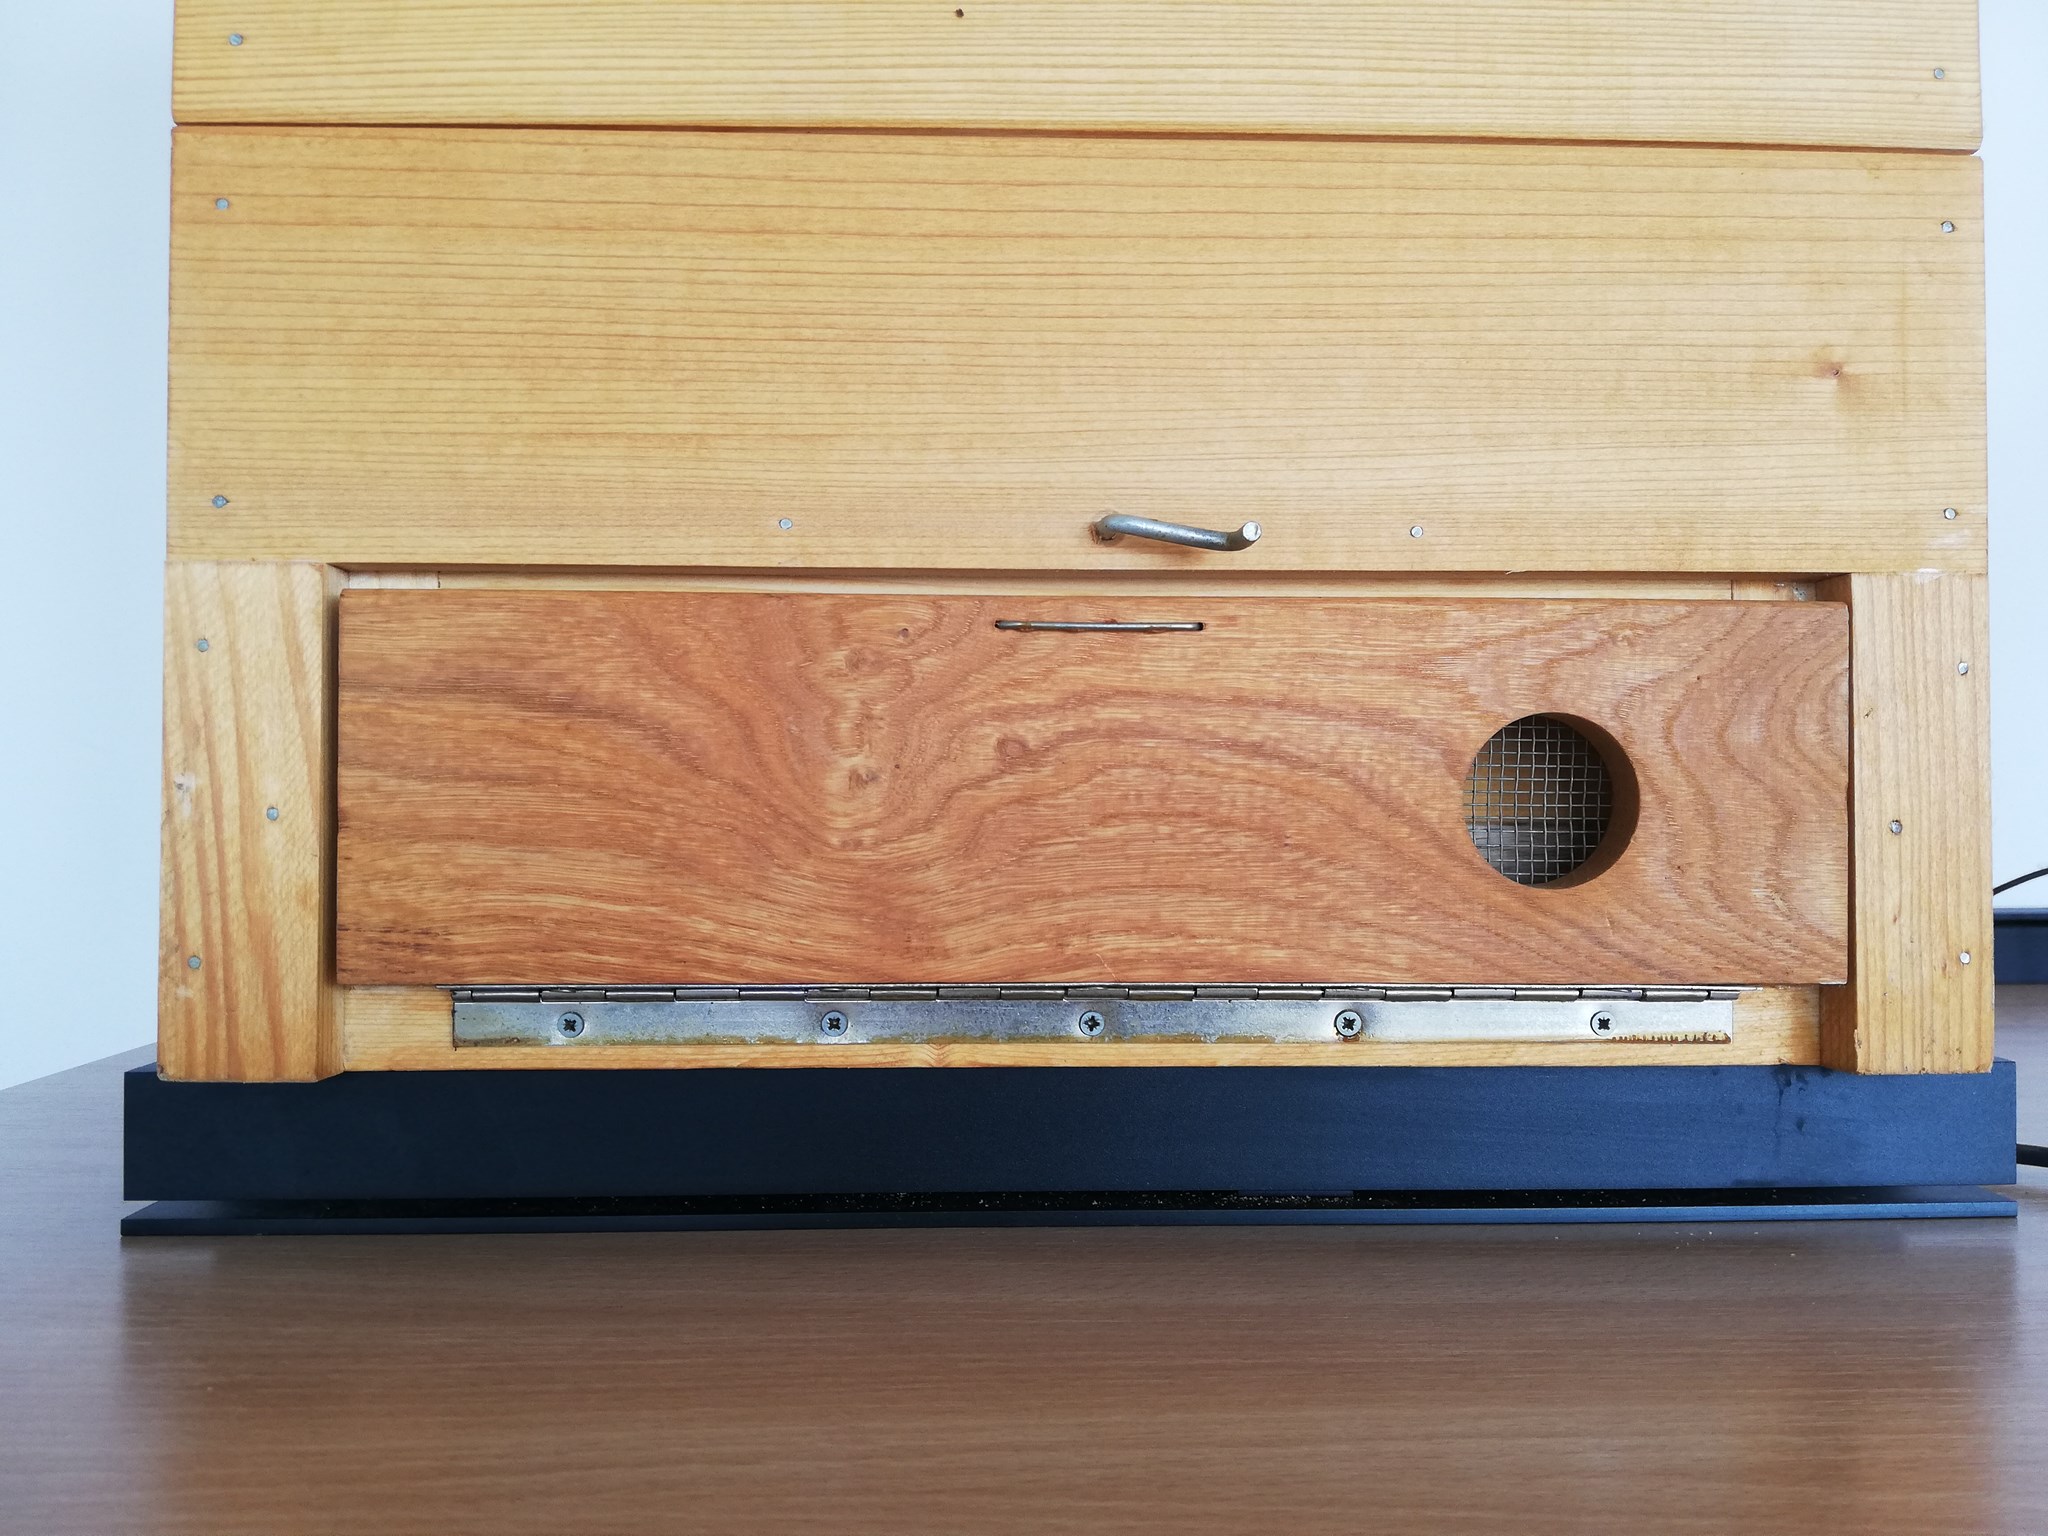
Sensors under the hive
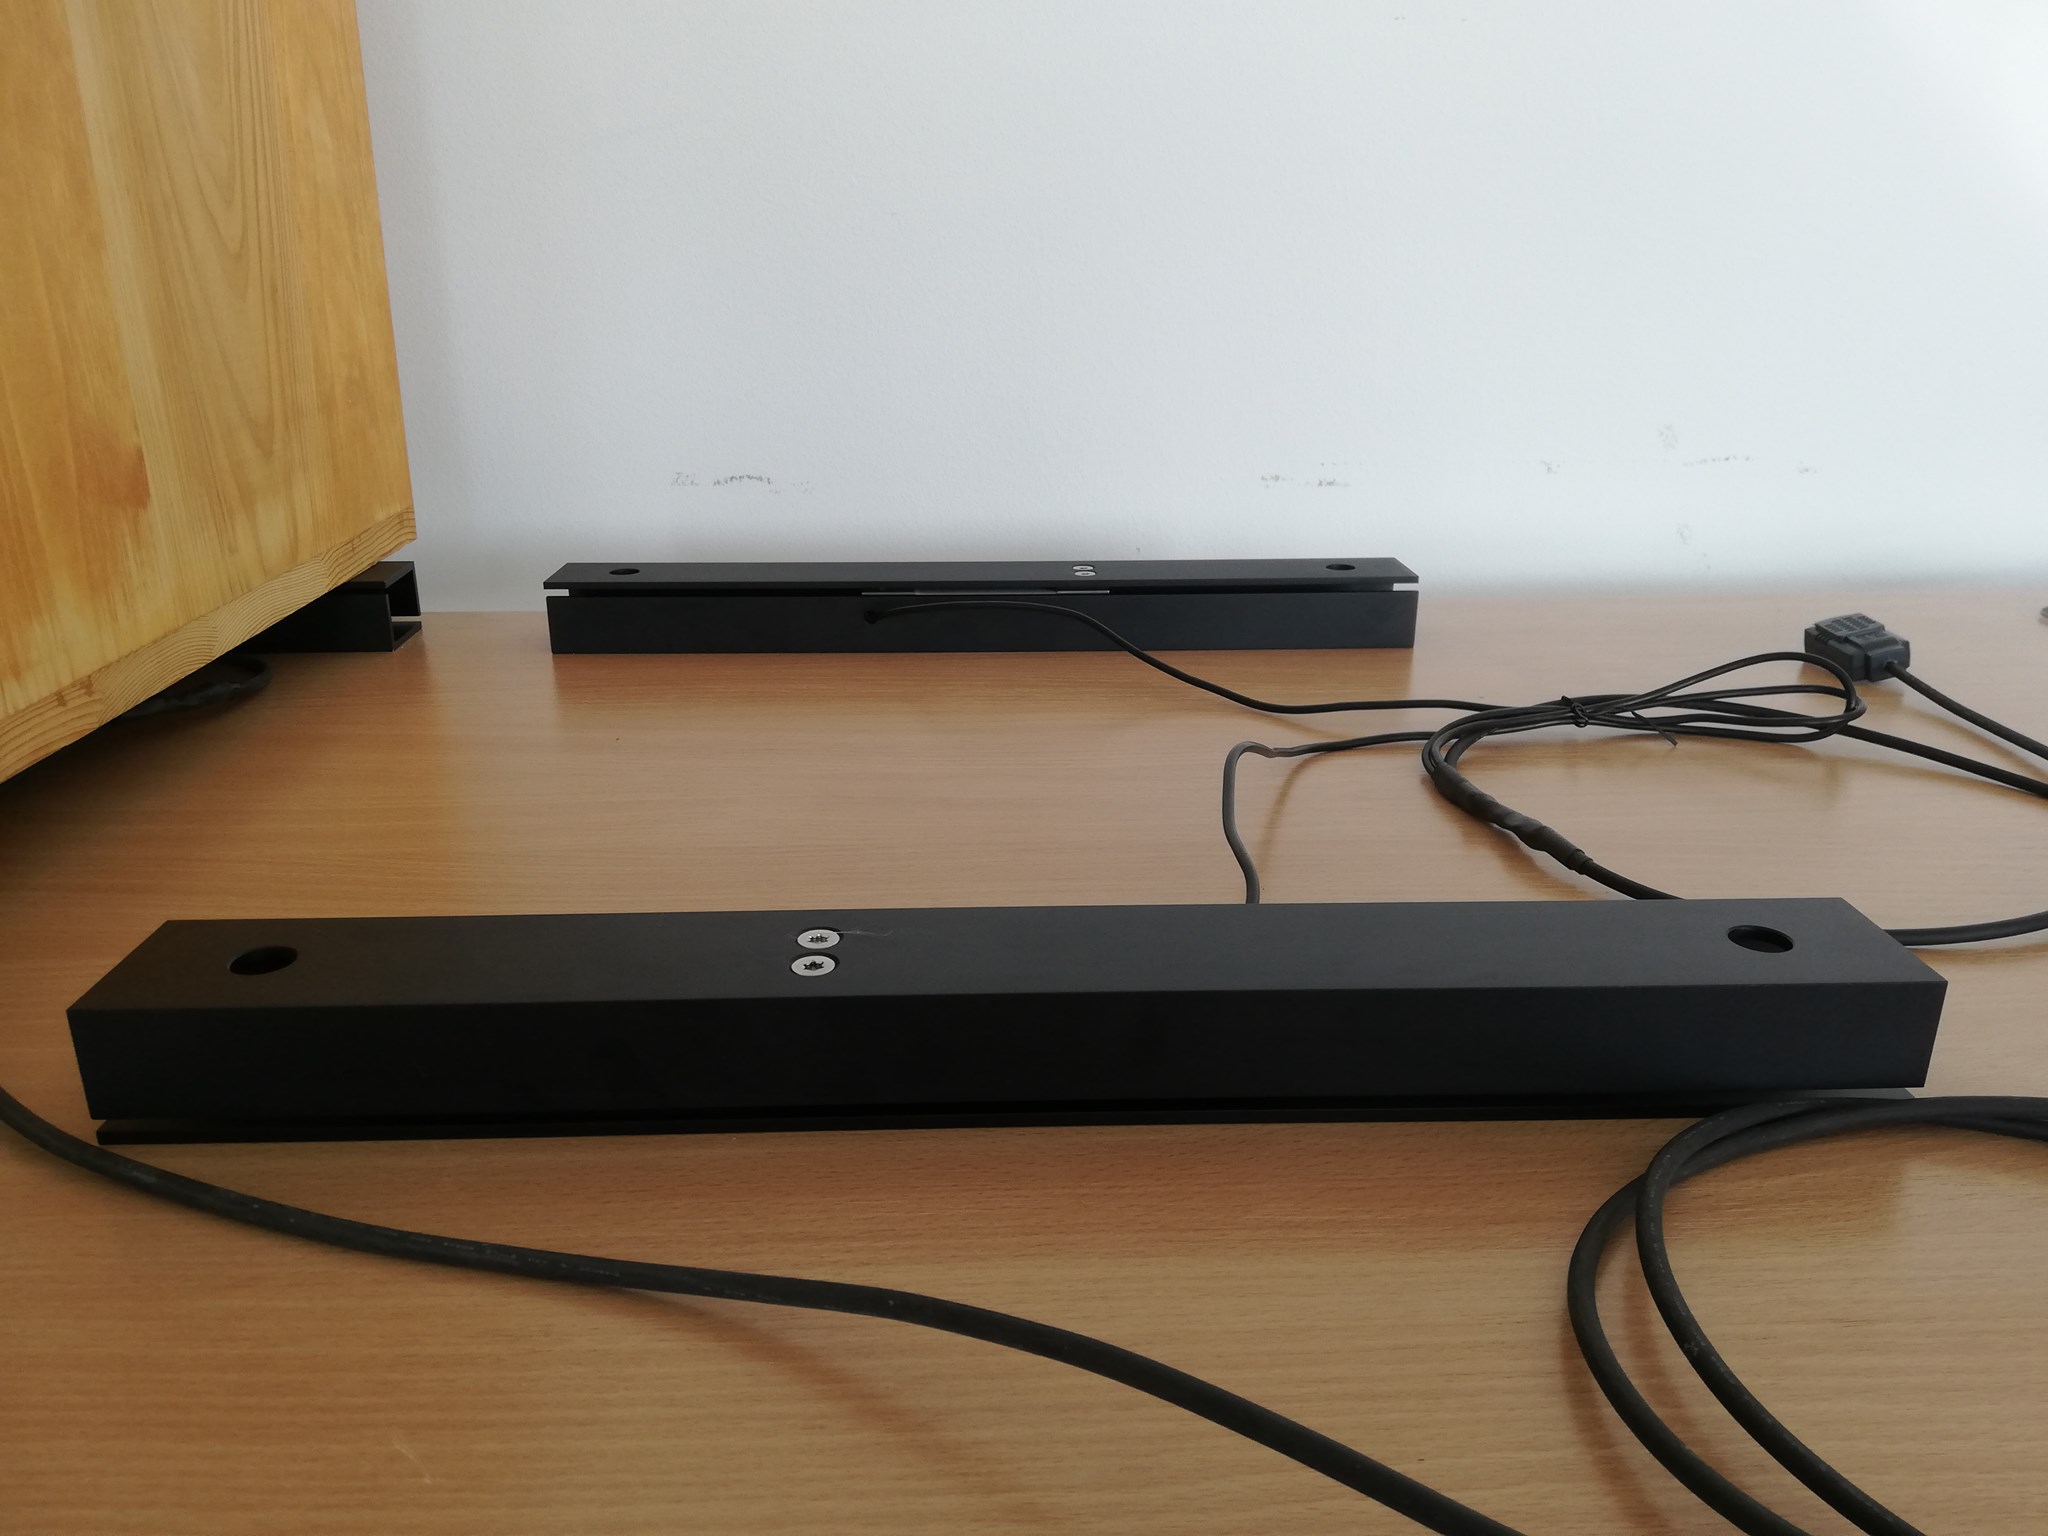
Weight sensors
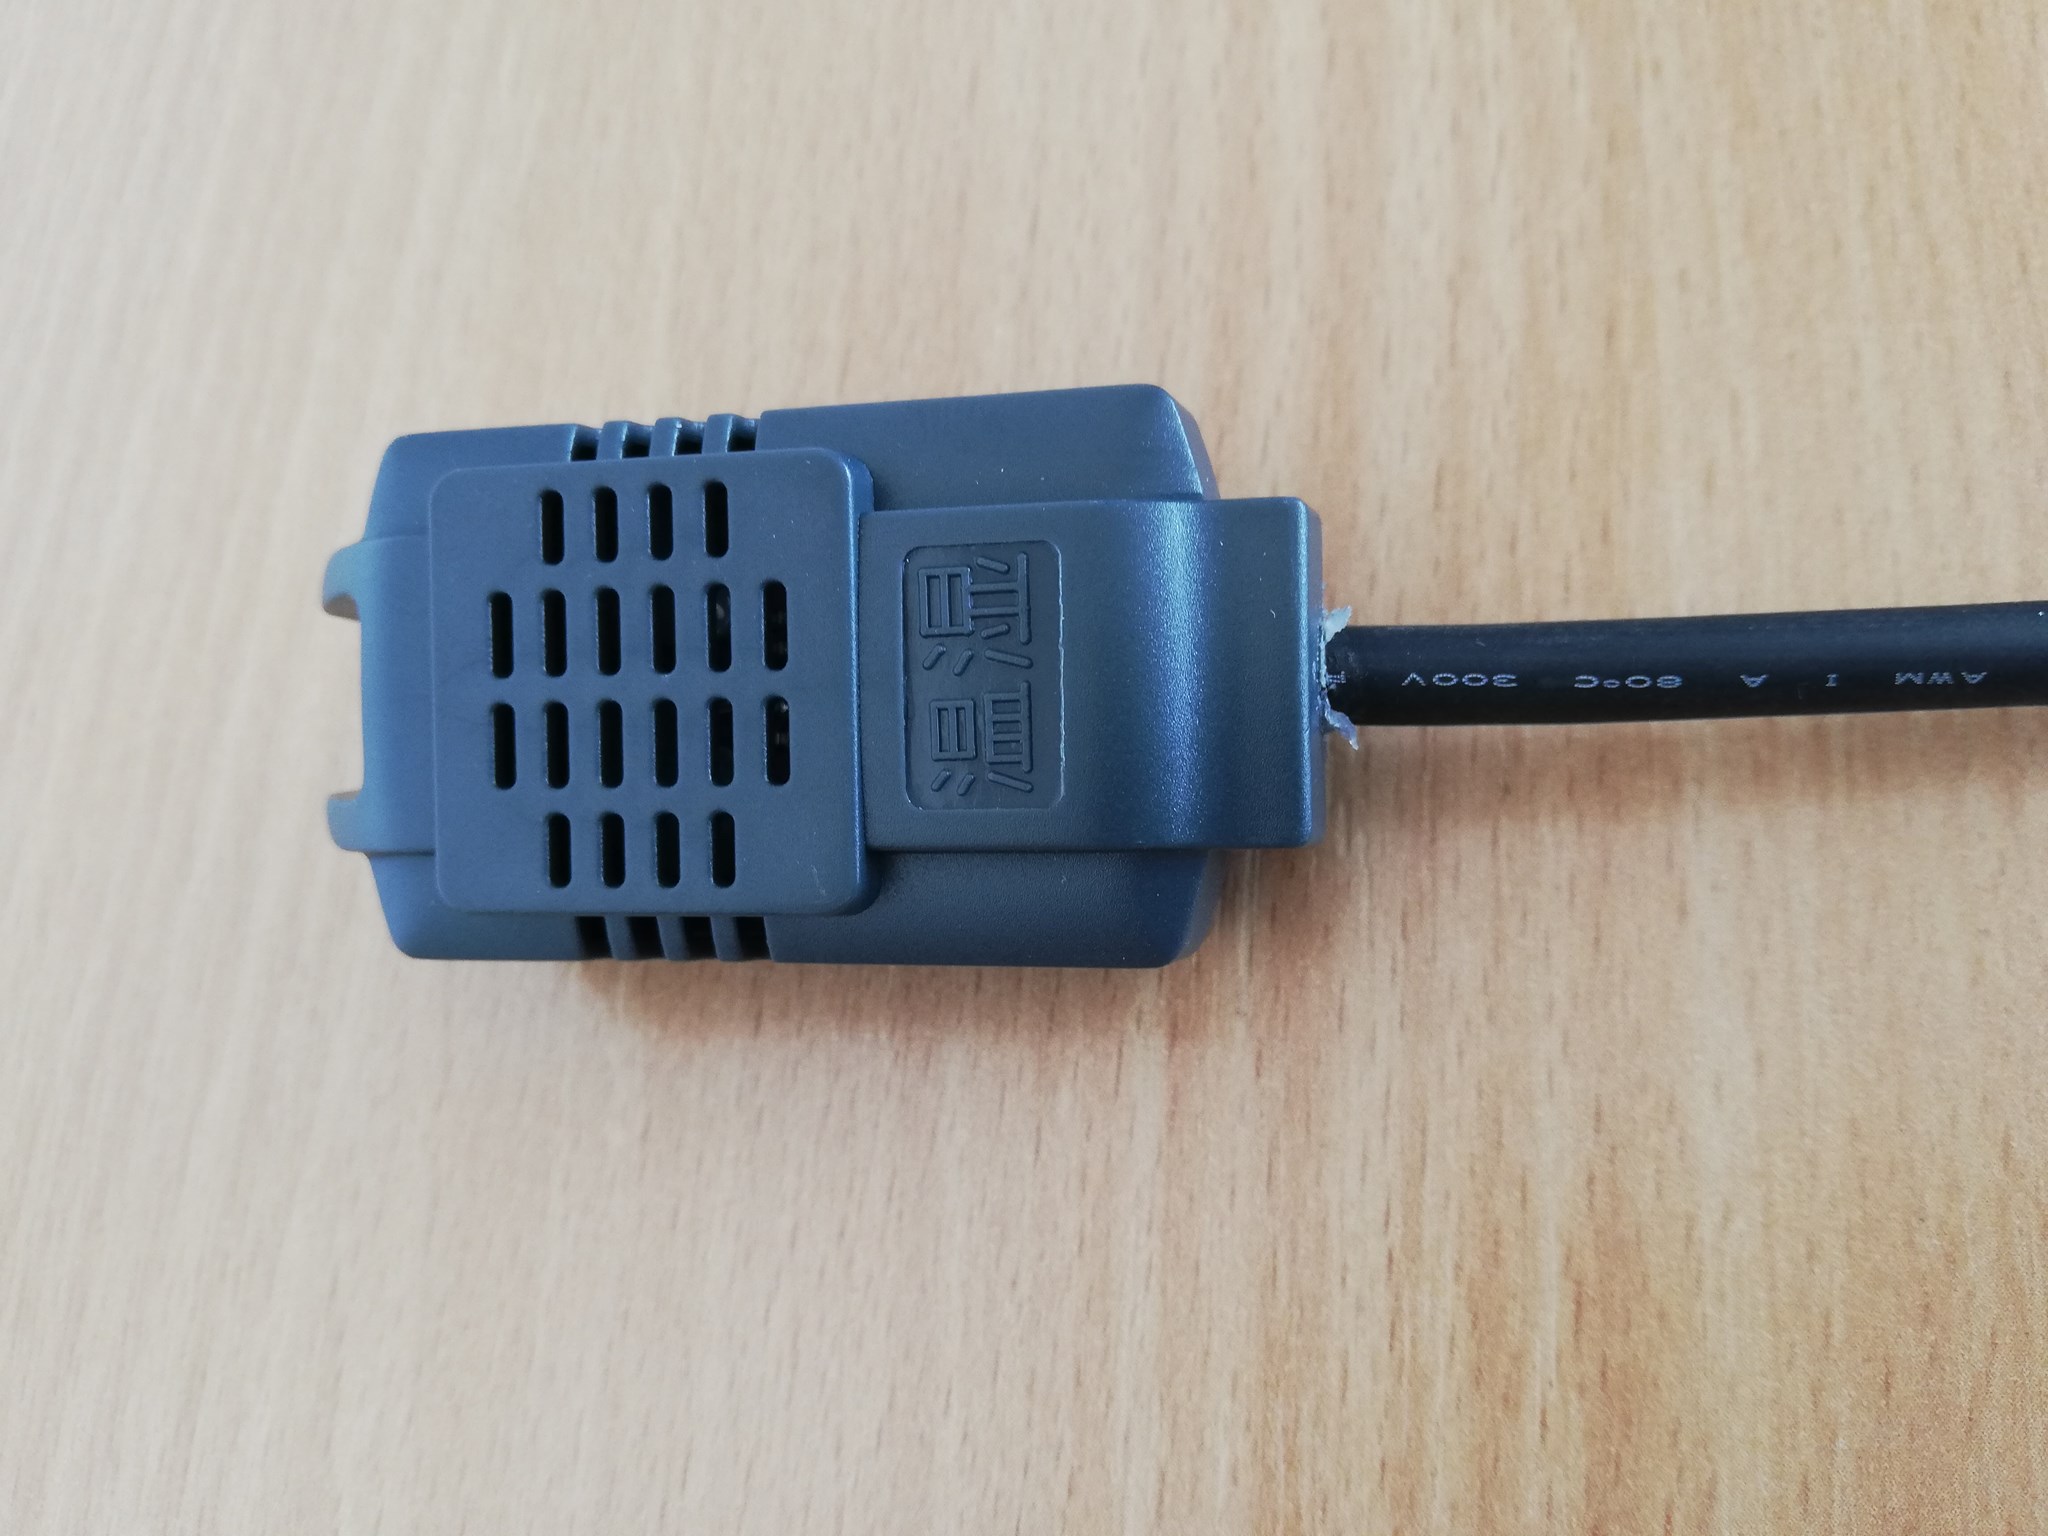
Weather sensor for measuring temperature, humidity and pressure
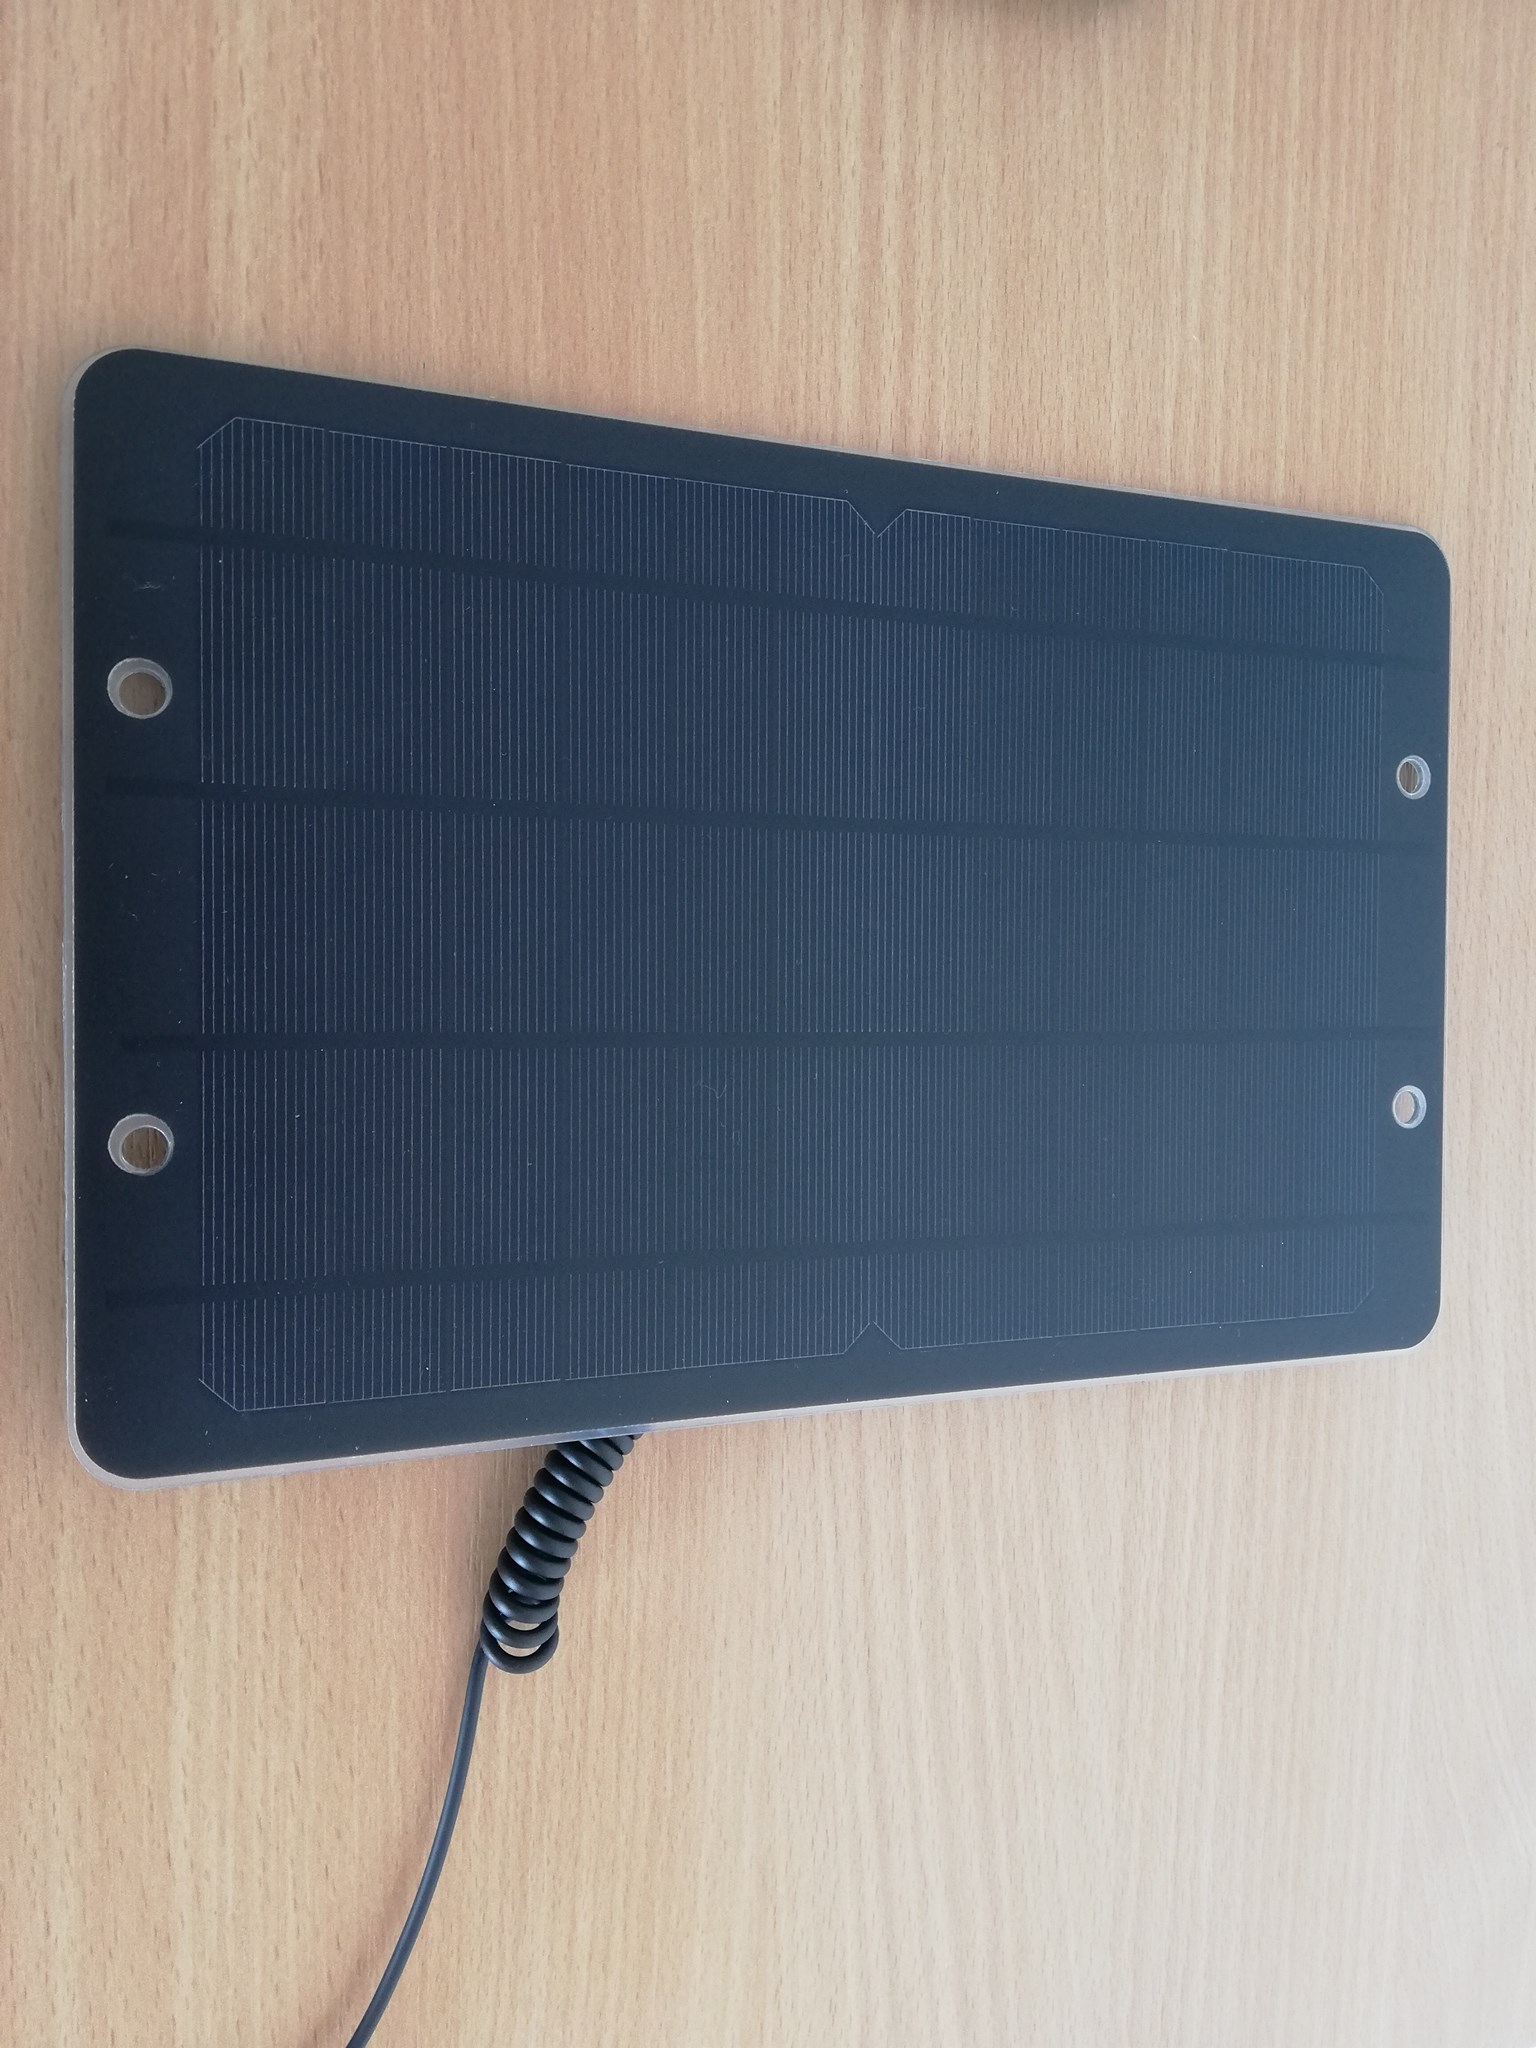
Solar cell
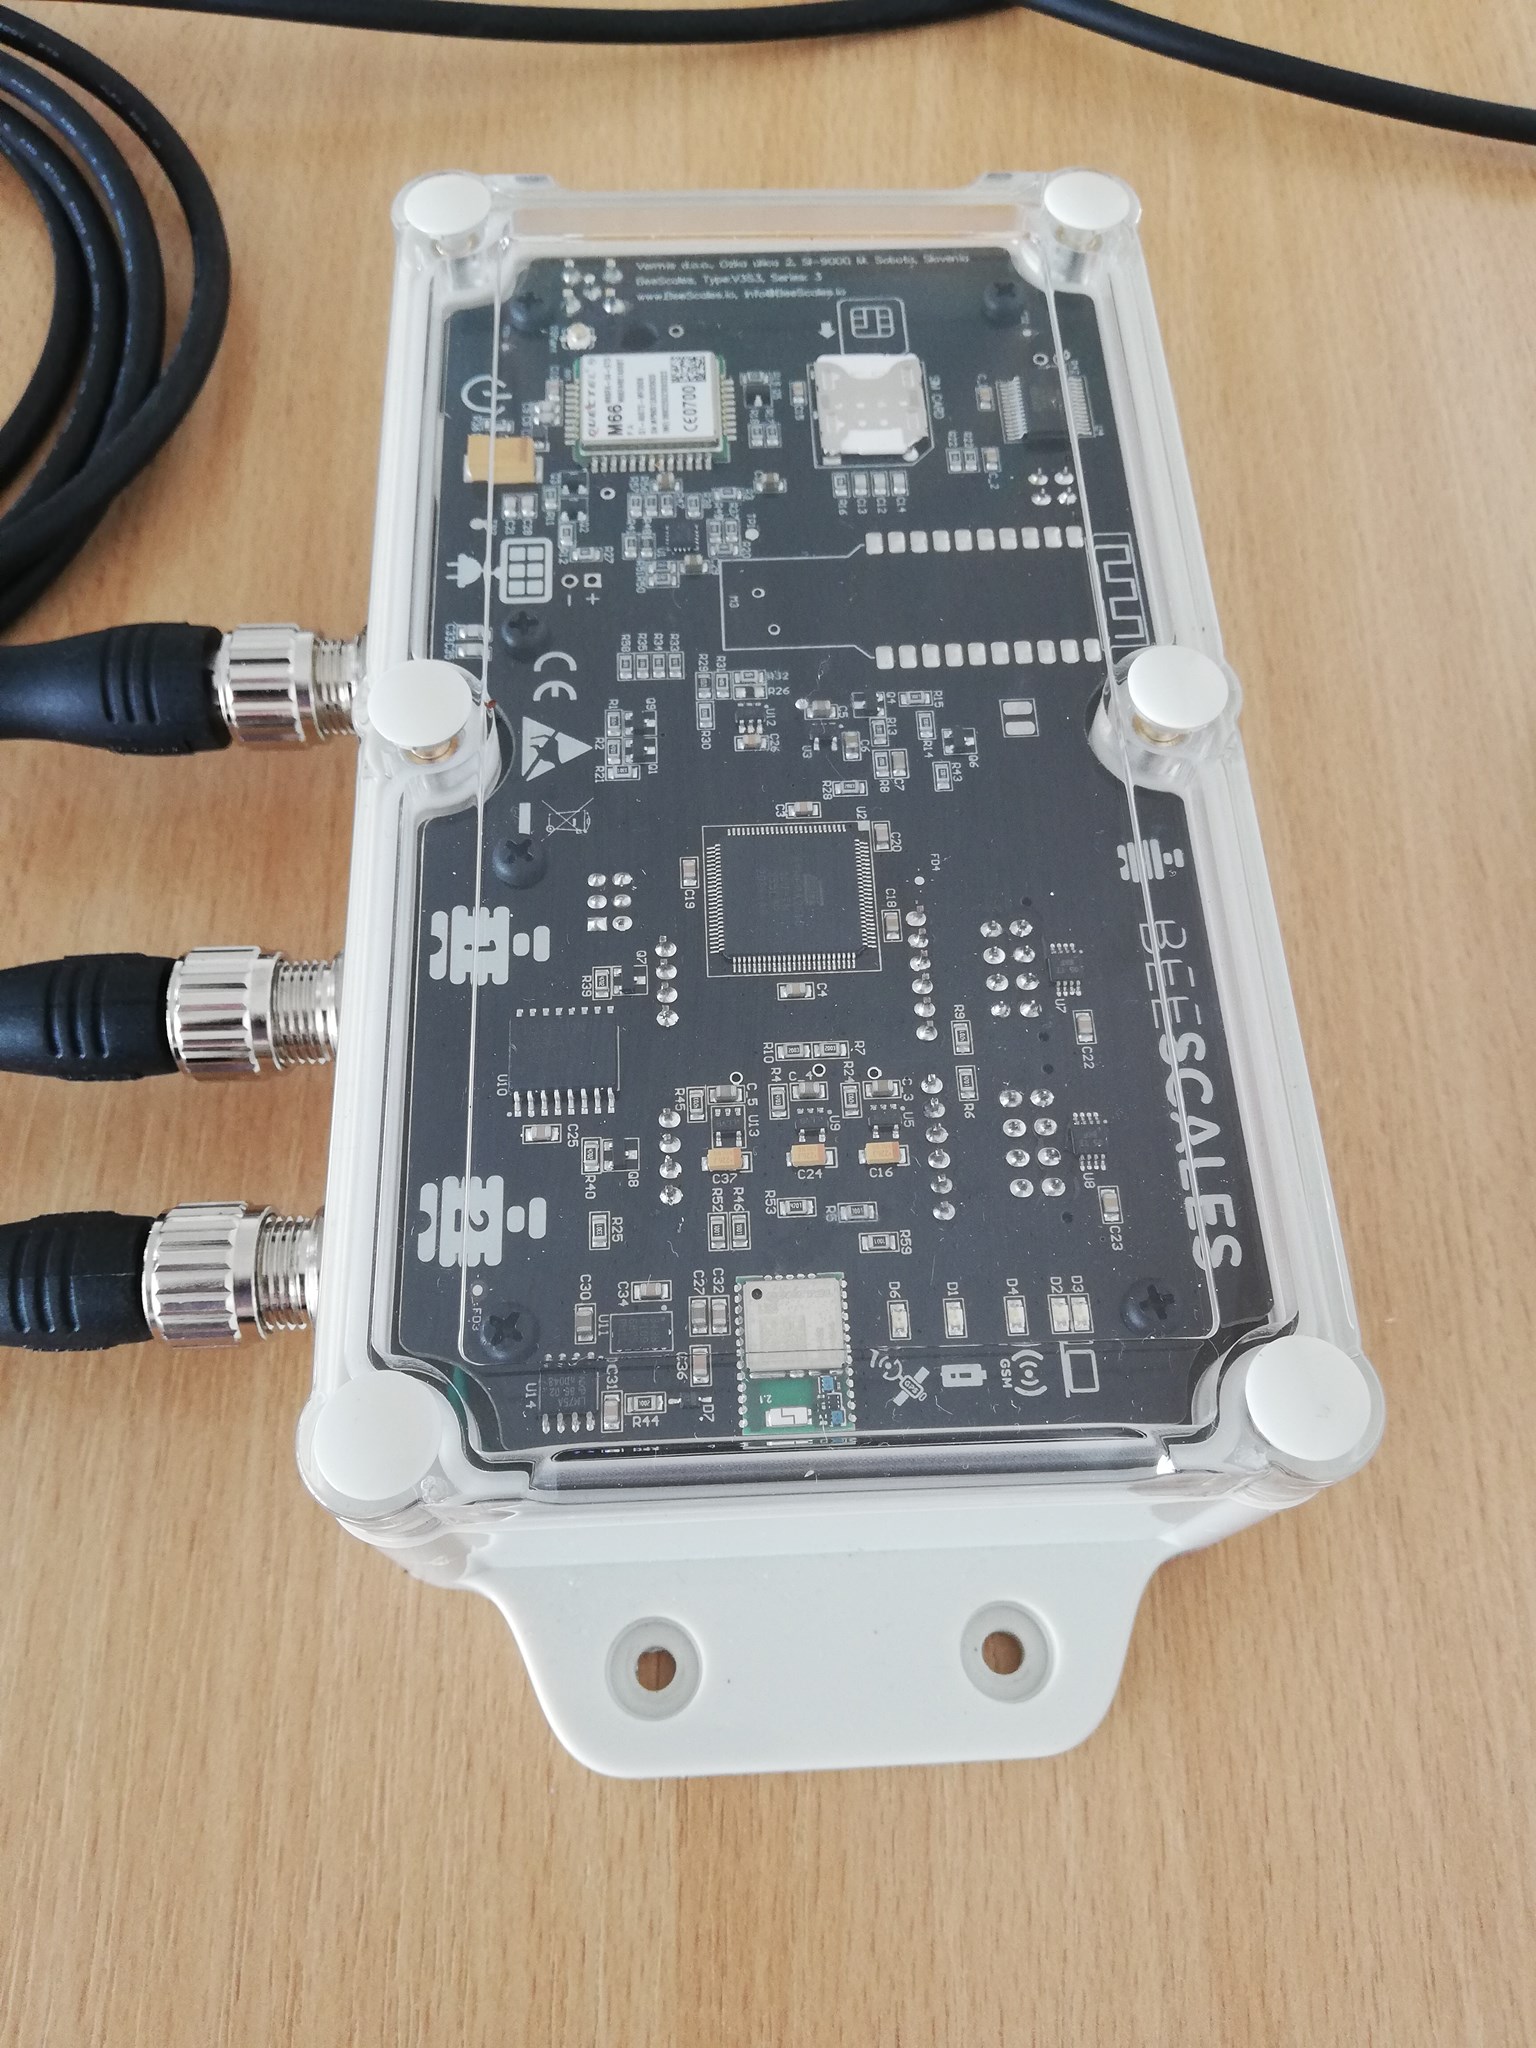
central unit